Bitcoin (BTC) remains in positive territory, holding steady above the $102,000 mark as of Friday. The cryptocurrency has surged over 7% this week. Recent US macroeconomic data has bolstered the growth of risk assets such as Bitcoin. According to a report by K33, the appeal of selling BTC during the US President-elect Donald Trump’s inauguration on Monday is gradually diminishing. Bitcoin Weekly Forecast shows continued positive momentum with potential for further gains.
Bitcoin Holding Strong Above $100K Before Trump’s Inauguration
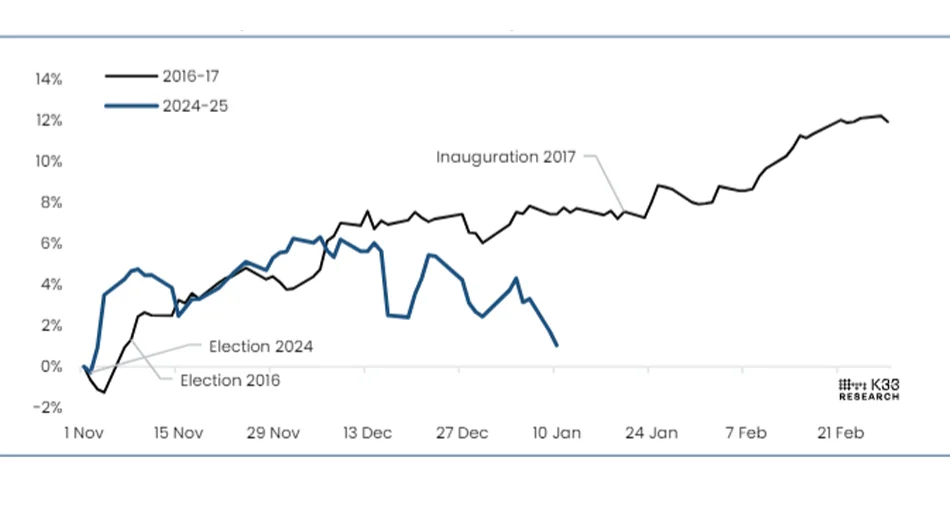
Bitcoin’s price has risen over 7% this week, now surpassing $102,000. A K33 report suggests that selling BTC during Trump’s inauguration is becoming less appealing. The market initially surged with optimism about Trump’s presidency, but caution has taken over in recent weeks.
The report notes that the S&P 500’s early post-election response in 2024 was similar to 2016, though it diverged after the December Federal Reserve meeting. In 2016, the S&P 500 saw steady growth as Trump entered office.
The report further states that Trump’s first term saw stock market growth driven by policies, tax cuts, deregulation, and trade deals a trend expected to continue in his second term. While selling at the inauguration seemed like a good strategy earlier, it now appears less attractive unless momentum picks up in the coming days. Long-term bullish expectations for Bitcoin remain, based on Trump’s influence.

The anticipation surrounding Donald Trump’s inauguration on Monday, coupled with expectations that the US Securities and Exchange Commission (SEC) will revise its cryptocurrency policies upon his taking office, is influencing market sentiment. Additionally, the ceasefire between Israel and Hamas is contributing to the overall positive outlook in the markets as of now.
Positive US Macroeconomic Data Bolsters Bitcoin’s Momentum
This week, Bitcoin’s price was supported by key US macroeconomic data. On Tuesday, the Producer Price Index (PPI) for December showed a modest 0.2% increase, falling short of the expected 0.3% and November’s 0.4%. The core PPI, excluding volatile items like energy and food, remained flat. This followed a positive jobs report and created uncertainty around the Federal Reserve’s next interest rate moves, putting pressure on the US Dollar. Bitcoin reacted positively, rising 2.14%.
On Wednesday, the Consumer Price Index (CPI) for December came in at 2.9%, matching expectations and higher than November’s 2.7%. Slower core CPI inflation raised hopes of disinflation, benefiting assets like Bitcoin, which surged past $100K.
On Thursday, retail sales data came in weaker than expected, with a 0.4% increase, below the forecasted 0.6%. However, the Retail Sales Control Group rose by 0.7%, better than November’s 0.4%. Despite the mixed data, Bitcoin saw a slight 0.5% dip on Thursday, but by Friday, it was back on the rise, trading above $102,000.
US Macroeconomic Data Driving Bitcoin’s Price Up
This week, institutional demand for Bitcoin showed a modest rebound, though it remains weaker compared to December’s levels. Coinglass data indicates that the Bitcoin spot Exchange-Traded Fund (ETF) saw a net inflow of $887.3 million by Thursday, after a $312.8 million inflow the previous week. For a more significant price recovery and rally, the volume of ETF inflows will need to increase.

Key On-Chain Bitcoin Metrics to Watch
Santiment data highlights important on-chain metrics for traders to watch in the coming days.
Wallets holding at least 10 BTC are beginning to accumulate again, which is a promising sign after a brief stagnation in late December and early January. Historically, Bitcoin prices have followed the upward trend of this accumulation, indicating that the recent price rebound could be sustainable. However, traders should also monitor the decline in Tether (red line) and USD Coin (blue line) reserves held by major stakeholders, as these may rise again.

In the past six weeks, the number of non-empty Bitcoin wallets has been shrinking, with many smaller retail traders selling off their holdings, trying to time the market peak. However, this group is typically small, and they often misjudge market movements. Historically, Bitcoin has seen its biggest rallies when the number of non-empty wallets decreases, especially when larger players (whales) are capitalizing on the coins being sold by retail traders driven by Fear, Uncertainty, and Doubt (FUD).

Traders should keep an eye on social media trends surrounding Layer 1, Layer 2, and meme coins. Market peaks often coincide with a surge in interest in speculative assets lacking intrinsic value or strong development teams. Conversely, when Bitcoin and other blue-chip assets take center stage, it suggests potential for healthy market growth.
As shown in the graph below, discussions around Layer 1 and Layer 2 projects are currently balanced. What’s encouraging is the lack of Fear of Missing Out (FOMO) on meme coins, especially after recent market downturns. If this trend persists and the market shows signs of a genuine recovery, it could signal a more sustainable rally ahead.

Bitcoin Bull Aims for Its All-Time High of $108,353
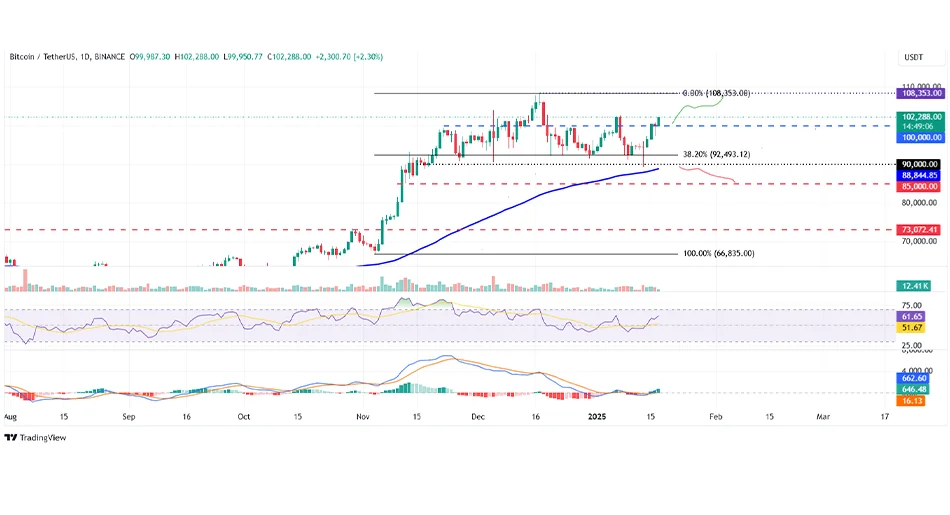
Bitcoin’s price rebounded strongly after testing the $90,000 support level on Monday, rising 5.77% and surpassing the $100K mark within three days. By Friday, BTC continues to climb, hovering around $102,000.
If this upward momentum holds, Bitcoin could be on track to test its all-time high of $108,353 from December 17, 2024.
The Relative Strength Index (RSI) on the daily chart is at 61, indicating increasing bullish momentum, well above the neutral 50 level. Additionally, the Moving Average Convergence Divergence (MACD) indicator turned bullish on Wednesday, signaling further potential for price gains.

However, if Bitcoin experiences a pullback and drops below the $100,000 support level, it could face further decline, potentially testing the next support at $90,000.
