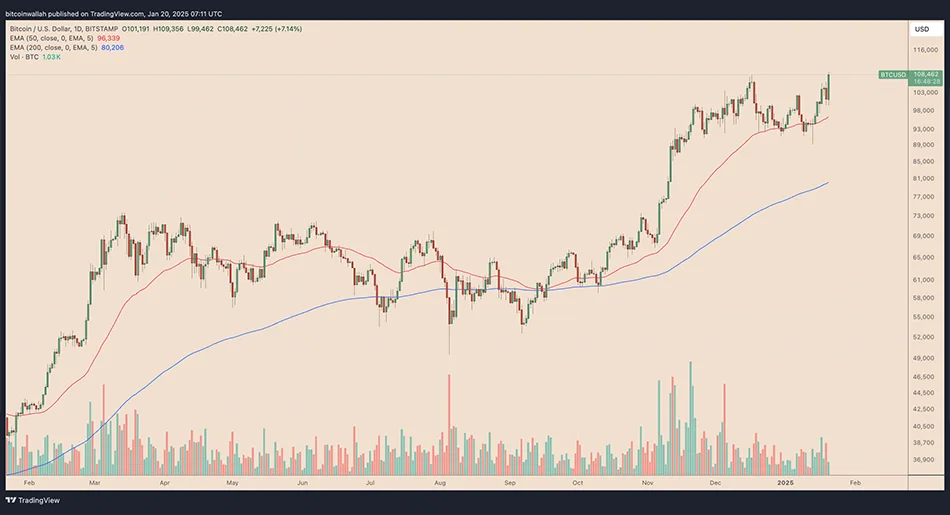
Bitcoin’s price has skyrocketed to a record high just hours before Donald Trump’s inauguration, with charts indicating the potential for further growth, possibly reaching $128,000. On January 20, Bitcoin’s price rising today surged over 8%, hitting an all-time high of $109,356, according to Bitstamp data. This increase marks a 70% rise since Trump’s victory in November.

Bitcoin’s Inauguration Surge
The recent surge in Bitcoin’s price coincides with the final hours before Donald Trump takes office as the 47th President of the United States. As Trump assumes the presidency, speculation is rife that he will use his executive powers to loosen regulations on cryptocurrency businesses and promote the adoption of digital assets early in his tenure.
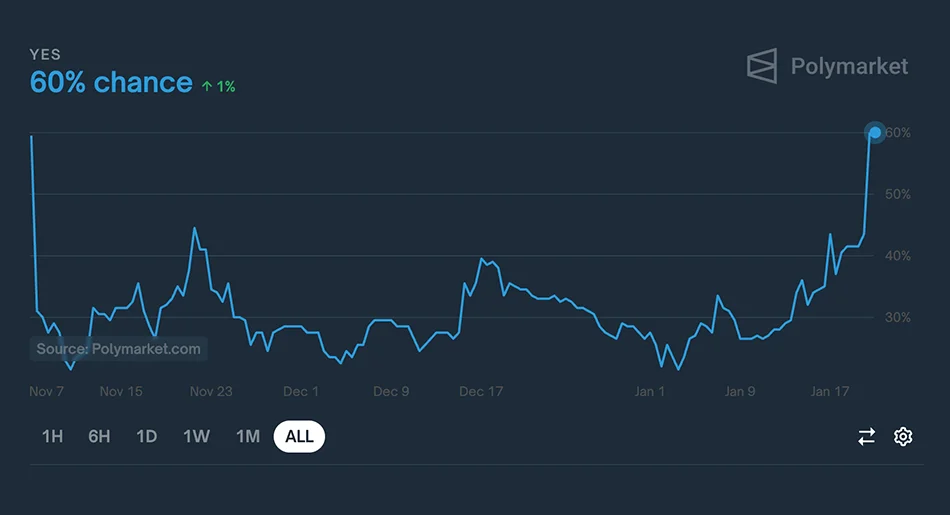
In particular, Trump has expressed intentions to include Bitcoin in the U.S. Strategic Reserve, a move that has generated significant speculation. As of January 20, there’s a 58-60% chance, according to Polymarket, that this proposal will be enacted within the first 100 days of Trump’s presidency.

Additionally, Trump is expected to sign an executive order creating a cryptocurrency advisory council, a proposal he first mentioned in July. The council would bring together industry leaders and policymakers to develop a regulatory framework that is more favorable to cryptocurrencies, as confirmed by two anonymous sources who spoke to Reuters.
Bitcoin ETFs See Massive Inflows
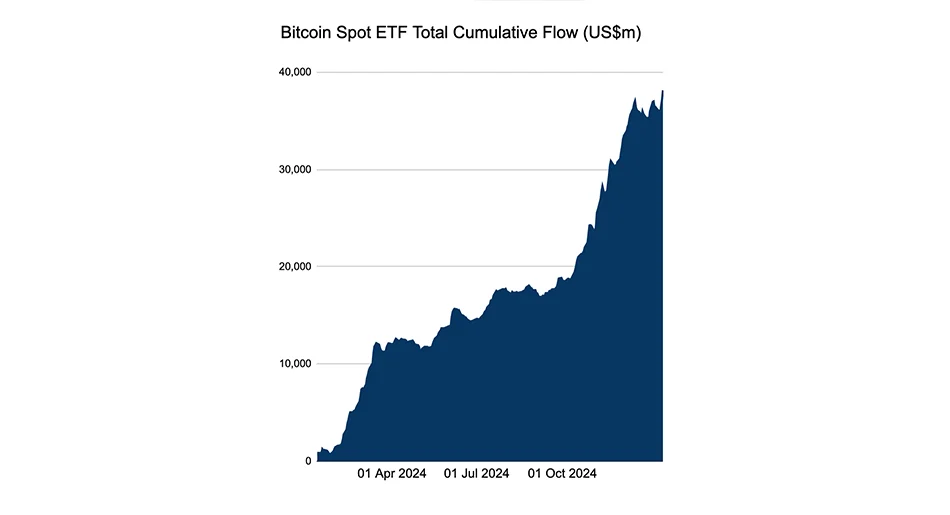
Another factor contributing to Bitcoin’s price surge is the record inflows into U.S.-based Bitcoin ETFs. As of January 17, the assets under management in U.S. spot Bitcoin ETFs reached a record $38.16 billion, fueled by $2.35 billion in inflows over just three days, according to Farside Investors.

This influx signals growing investor confidence in Bitcoin, particularly from institutional players who see ETFs as a safe, regulated way to gain exposure to the cryptocurrency.
Bitcoin’s Symmetrical Triangle Points to $128K
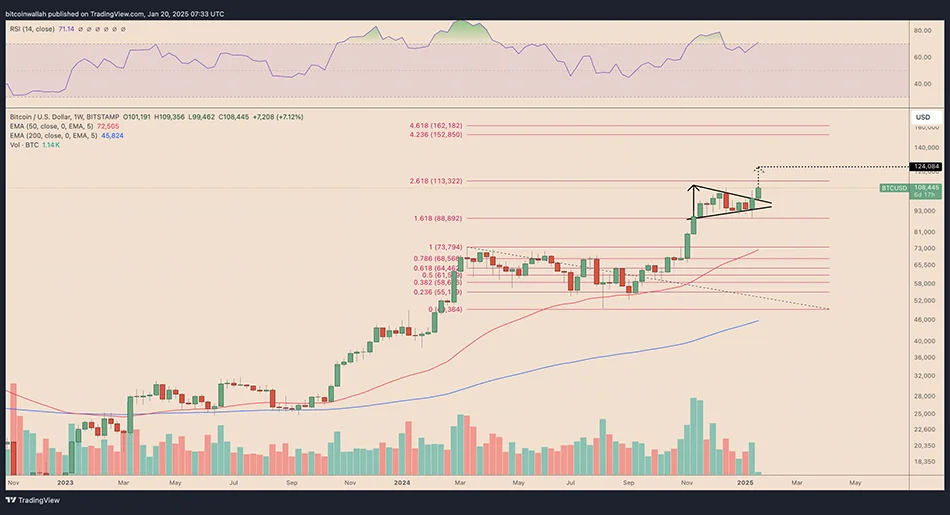
The recent price increase is part of a larger breakout on Bitcoin’s weekly chart from a symmetrical triangle pattern. This type of pattern, when formed during an uptrend, is typically a bullish continuation signal. The pattern usually resolves when the price breaks above the upper trendline, with the potential for further increases based on the distance between the upper and lower trendlines.

Applying this technical analysis to the BTC/USD chart suggests that Bitcoin could reach a target of over $128,000 by March, provided the price continues its bullish trajectory
